New York Jets 17–20 Green Bay Packers

- Season
- NFL
- 2026 · Regular Season · Week 2
NFL: Green Bay Packers beat New York Jets 20–17.
Game leaders
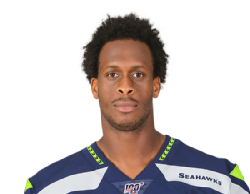 247Geno SmithPassing yards
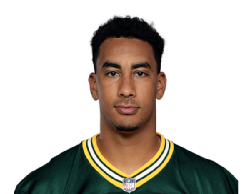 145Jordan Love
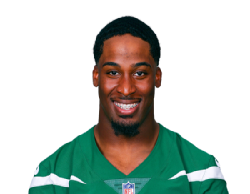 29Breece HallRushing yards
 32Kaleb Johnson
- 63Breece HallReceiving yards
 58Matthew Golden
How the score moved
The running score, step by step, with every score marked.
- New York Jets
- Green Bay Packers
Show as a table
| When | New York Jets | Green Bay Packers |
|---|---|---|
| Q2 9:35 · MarShawn Lloyd | 0 | 7 |
| Q2 6:04 · Braelon Allen | 7 | 7 |
| Q3 2:30 · Garrett Wilson | 14 | 7 |
| Q4 11:04 · Jason Sanders | 17 | 7 |
| Q4 7:58 · Christian Watson | 17 | 14 |
| Q4 2:59 · Trey Smack | 17 | 17 |
| OT 5:23 · Trey Smack | 17 | 20 |
| 75′ | 17 | 20 |
How efficient each offense was
Conversions on the downs that keep drives alive, yards gained per snap and per drive, how each side moved the ball, and who held it.
- New York Jets
- Green Bay Packers
Third-down conversions
42%8/1911%1/9
Fourth-down conversions
0%0/10%0/1
Red-zone touchdowns
67%2/350%2/4
- 4.04.0Yards per play
- 1.421.67Points per drive
- 23.816.6Yards per drive
- 7250Plays
How the yards came
New York Jets
Pass 218Rush 67
Green Bay Packers
Pass 136Rush 63
- Time of possession
- 37:4026:57
- Turnover margin
- +1-1
- Sacks made
- 34
- Penalties (yards)
- 13 (156)14 (133)
Show as a table
| New York Jets | Green Bay Packers | |
|---|---|---|
| Third-down conversions | 8/19 | 1/9 |
| Fourth-down conversions | 0/1 | 0/1 |
| Red-zone touchdowns | 2/3 | 2/4 |
| Yards per play | 4.0 | 4.0 |
| Points per drive | 1.42 | 1.67 |
| Yards per drive | 23.8 | 16.6 |
| Plays | 72 | 50 |
| Passing yards | 218 | 136 |
| Rushing yards | 67 | 63 |
| Time of possession | 37:40 | 26:57 |
| Turnovers | 0 | 1 |
| Penalties (yards) | 13 (156) | 14 (133) |
Scoring plays
Q2
- Q2 9:350–7MarShawn Lloyd(Touchdown)
- Braelon Allen(Touchdown)Q2 6:047–7
- Q2 9:350–7
Q3
- Garrett Wilson(Touchdown)Q3 2:3014–7
Q4
- Jason Sanders(Field goal)Q4 11:0417–7
- Q4 7:5817–14Christian Watson(Touchdown)
- Q4 2:5917–17Trey Smack(Field goal)
OT
- OT 5:2317–20Trey Smack(Field goal)
- OT 5:2317–20
Key stats
- 285Total yards199
- 218Passing yards136
- 67Rushing yards63
- 21First downs16
- 72Total plays50
- 4.0Yards per play4.0
- 4.8Yards per pass4.3
- 2.5Yards per rush3.5
- 27/41Comp / Att16/29
- 27Rushing attempts18
Quarter by quarter
New York Jets led after 1 of 5 quarters, Green Bay Packers after 1. Largest lead at a break: 7 points, New York Jets after Q3. Counted at the end of each period, not throughout.
- New York Jets
- Green Bay Packers
| Team | Q1 | Q2 | Q3 | Q4 | OT | T |
|---|---|---|---|---|---|---|
| New York Jets | 0 | 7 | 7 | 3 | 0 | 17 |
| Green Bay Packers | 0 | 7 | 0 | 10 | 3 | 20 |
Facts
From each side's recent results and their meetings, before this game.
 New York Jets: 2 won, 2 lost in their last 4 games.
- New York Jets scored 62 points and allowed 57 in their last 4 games.
 Green Bay Packers: 2 won, 2 lost in their last 4 games.
- Green Bay Packers scored 106 points and allowed 118 in their last 4 games.
Recent form
Standings
American Football Conference · AFC East
| POS | Team | W | L | T | PF | PA | PCT |
|---|---|---|---|---|---|---|---|
| 1 |  Buffalo Bills | 5 | 1 | 0 | 197 | 171 | .833 |
| 2 |  New England Patriots | 4 | 3 | 0 | 160 | 143 | .571 |
| 3 | New York Jets | 2 | 5 | 0 | 137 | 150 | .286 |
| 4 |  Miami Dolphins | 1 | 5 | 0 | 98 | 157 | .167 |
National Football Conference · NFC North
| POS | Team | W | L | T | PF | PA | PCT |
|---|---|---|---|---|---|---|---|
| 1 |  Minnesota Vikings | 6 | 0 | 0 | 125 | 74 | 1.000 |
| 2 |  Chicago Bears | 5 | 2 | 0 | 180 | 143 | .714 |
| 3 |  Detroit Lions | 4 | 2 | 0 | 184 | 165 | .667 |
| 4 | Green Bay Packers | 4 | 3 | 0 | 144 | 145 | .571 |
Timeline
Q2
- Q2 9:350–7MarShawn Lloyd(Touchdown)
- Braelon Allen(Touchdown)Q2 6:047–7
- Q2 9:350–7
Q3
- Garrett Wilson(Touchdown)Q3 2:3014–7
Q4
- Jason Sanders(Field goal)Q4 11:0417–7
- Q4 7:5817–14Christian Watson(Touchdown)
- Q4 2:5917–17Trey Smack(Field goal)
OT
- OT 5:2317–20Trey Smack(Field goal)
- OT 5:2317–20
How efficient each offense was
Conversions on the downs that keep drives alive, yards gained per snap and per drive, how each side moved the ball, and who held it.
- New York Jets
- Green Bay Packers
Third-down conversions
42%8/1911%1/9
Fourth-down conversions
0%0/10%0/1
Red-zone touchdowns
67%2/350%2/4
- 4.04.0Yards per play
- 1.421.67Points per drive
- 23.816.6Yards per drive
- 7250Plays
How the yards came
New York Jets
Pass 218Rush 67
Green Bay Packers
Pass 136Rush 63
- Time of possession
- 37:4026:57
- Turnover margin
- +1-1
- Sacks made
- 34
- Penalties (yards)
- 13 (156)14 (133)
Show as a table
| New York Jets | Green Bay Packers | |
|---|---|---|
| Third-down conversions | 8/19 | 1/9 |
| Fourth-down conversions | 0/1 | 0/1 |
| Red-zone touchdowns | 2/3 | 2/4 |
| Yards per play | 4.0 | 4.0 |
| Points per drive | 1.42 | 1.67 |
| Yards per drive | 23.8 | 16.6 |
| Plays | 72 | 50 |
| Passing yards | 218 | 136 |
| Rushing yards | 67 | 63 |
| Time of possession | 37:40 | 26:57 |
| Turnovers | 0 | 1 |
| Penalties (yards) | 13 (156) | 14 (133) |
Where the points came from, quarter by quarter
Each side's points in each quarter, split by how they were scored.
- New York Jets
- Green Bay Packers
- Touchdowns
- Field goals
- Extra points and conversions
7
7
7
3
10
3
Show as a table
| Quarter | New York Jets · Touchdowns | Green Bay Packers · Touchdowns | New York Jets · Field goals | Green Bay Packers · Field goals | New York Jets · Extra points and conversions | Green Bay Packers · Extra points and conversions |
|---|---|---|---|---|---|---|
| Q1 | 0 | 0 | 0 | 0 | 0 | 0 |
| Q2 | 6 | 6 | 0 | 0 | 1 | 1 |
| Q3 | 6 | 0 | 0 | 0 | 1 | 0 |
| Q4 | 0 | 6 | 3 | 3 | 0 | 1 |
| OT | 0 | 0 | 0 | 3 | 0 | 0 |
The yards, and how efficiently they came
Each side's leading passer, rusher and receiver, with the rate behind the total.
Passing
Geno Smith
27/41 completions
247yards1 TD
Jordan Love
16/29 completions
145yards2 TD
Rushing
Breece Hall
16 carries
29yards
Kaleb Johnson
8 carries
32yards
Receiving
Breece Hall
5/5 caught/targeted
63yards
Matthew Golden
4/6 caught/targeted
58yards
- New York Jets
- Green Bay Packers
Offence
- 285Total yards199
- 218Passing yards136
- 67Rushing yards63
- 21First downs16
- 72Total plays50
- 4.0Yards per play4.0
- 4.8Yards per pass4.3
- 2.5Yards per rush3.5
- 27/41Comp / Att16/29
- 27Rushing attempts18
Efficiency
- 8-193rd down efficiency1-9
- 0-14th down efficiency0-1
- 2-3Red zone (made / att)2-4
- 12Drives12
- 37:40Possession26:57
Turnovers & penalties
- 0Turnovers1
- 0Interceptions thrown0
- 0Fumbles lost1
- 13-156Penalties14-133
- 3Sacks4
- 4-29Sacks – yards lost3-9
Defence
- 0Interceptions0
- 0Interception touchdowns0
- 0Safeties0
Quarter by quarter
New York Jets led after 1 of 5 quarters, Green Bay Packers after 1. Largest lead at a break: 7 points, New York Jets after Q3. Counted at the end of each period, not throughout.
- New York Jets
- Green Bay Packers
| Team | Q1 | Q2 | Q3 | Q4 | OT | T |
|---|---|---|---|---|---|---|
| New York Jets | 0 | 7 | 7 | 3 | 0 | 17 |
| Green Bay Packers | 0 | 7 | 0 | 10 | 3 | 20 |
Passing
| Geno Smith | 27/41 | 247 | 6.0 | 1 | 4-29 | 44.5 |
Rushing
| Breece Hall | 16 | 29 | 1.8 | 0 | 14 |
| Geno Smith | 5 | 17 | 3.4 | 0 | 7 |
| Isaiah Williams | 1 | 14 | 14.0 | 0 | 14 |
| Braelon Allen | 5 | 7 | 1.4 | 1 | 5 |
Receiving
| Breece Hall | 5 | 5 | 63 | 12.6 | 0 | 43 |
| Adonai Mitchell | 12 | 6 | 63 | 10.5 | 0 | 15 |
| Garrett Wilson | 7 | 5 | 57 | 11.4 | 1 | 17 |
| Isaiah Williams | 6 | 6 | 34 | 5.7 | 0 | 9 |
| Kenyon Sadiq | 3 | 2 | 17 | 8.5 | 0 | 12 |
| Braelon Allen | 1 | 1 | 8 | 8.0 | 0 | 8 |
| Jeremy Ruckert | 2 | 2 | 5 | 2.5 | 0 | 5 |
Fumbles
Defensive
| Dane Belton | 6 | 4 | 0 | 0 | 0 | 0 | 0 |
| Jamien Sherwood | 6 | 3 | 0 | 1 | 1 | 0 | 0 |
| Andre Cisco | 5 | 4 | 0 | 1 | 1 | 1 | 1 |
| Demario Davis | 4 | 3 | 0 | 1 | 0 | 0 | 0 |
| Brandon Stephens | 4 | 3 | 0 | 0 | 0 | 0 | 0 |
| Jowon Briggs | 4 | 1 | 1 | 0 | 0 | 0 | 1 |
| T'Vondre Sweat | 4 | 1 | 0 | 0 | 0 | 0 | 0 |
| Kingsley Enagbare | 3 | 2 | 1 | 1 | 0 | 1 | 1 |
| David Bailey | 3 | 2 | 1 | 1 | 0 | 1 | 1 |
| Troy Reeder | 3 | 1 | 0 | 0 | 0 | 0 | 0 |
| Braiden McGregor | 3 | 1 | 0 | 0 | 0 | 0 | 0 |
| Azareye'h Thomas | 2 | 2 | 0 | 1 | 1 | 0 | 0 |
| Jarvis Brownlee | 2 | 1 | 0 | 0 | 0 | 0 | 0 |
| Darrell Jackson Jr. | 2 | 1 | 0 | 0 | 0 | 0 | 0 |
| Andrew Beck | 1 | 1 | 0 | 0 | 0 | 0 | 0 |
| Arian Smith | 1 | 1 | 0 | 0 | 0 | 0 | 0 |
| Isaiah Davis | 1 | 1 | 0 | 0 | 0 | 0 | 0 |
| Thomas Hennessy | 1 | 0 | 0 | 0 | 0 | 0 | 0 |
| Jason Sanders | 1 | 0 | 0 | 0 | 0 | 0 | 0 |
| Malachi Moore | 1 | 0 | 0 | 0 | 0 | 0 | 0 |
Kick returns
| Isaiah Williams | 5 | 124 | 24.8 | 28 |
Punt returns
| Isaiah Williams | 3 | 2 | 0.7 | 2 |
Kicking
| Jason Sanders | 1/1 | 100.0 | 32 | 2/2 | 5 |
Punting
| Austin McNamara | 7 | 344 | 49.1 | 1 | 2 | 58 |
American Football Conference · AFC East
| POS | Team | W | L | T | PF | PA | PCT |
|---|---|---|---|---|---|---|---|
| 1 | Buffalo Bills | 5 | 1 | 0 | 197 | 171 | .833 |
| 2 | New England Patriots | 4 | 3 | 0 | 160 | 143 | .571 |
| 3 | New York Jets | 2 | 5 | 0 | 137 | 150 | .286 |
| 4 | Miami Dolphins | 1 | 5 | 0 | 98 | 157 | .167 |
National Football Conference · NFC North
| POS | Team | W | L | T | PF | PA | PCT |
|---|---|---|---|---|---|---|---|
| 1 | Minnesota Vikings | 6 | 0 | 0 | 125 | 74 | 1.000 |
| 2 | Chicago Bears | 5 | 2 | 0 | 180 | 143 | .714 |
| 3 | Detroit Lions | 4 | 2 | 0 | 184 | 165 | .667 |
| 4 | Green Bay Packers | 4 | 3 | 0 | 144 | 145 | .571 |
American Football Conference · AFC North
| POS | Team | W | L | T | PF | PA | PCT |
|---|---|---|---|---|---|---|---|
| 1 |  Cleveland Browns | 5 | 2 | 0 | 133 | 146 | .714 |
| 2 |  Pittsburgh Steelers | 5 | 2 | 0 | 153 | 138 | .714 |
| 3 |  Cincinnati Bengals | 4 | 2 | 0 | 163 | 122 | .667 |
| 4 |  Baltimore Ravens | 4 | 3 | 0 | 169 | 167 | .571 |
American Football Conference · AFC South
| POS | Team | W | L | T | PF | PA | PCT |
|---|---|---|---|---|---|---|---|
| 1 |  Jacksonville Jaguars | 4 | 2 | 0 | 154 | 104 | .667 |
| 2 |  Indianapolis Colts | 2 | 5 | 0 | 154 | 180 | .286 |
| 3 |  Houston Texans | 2 | 5 | 0 | 165 | 170 | .286 |
| 4 |  Tennessee Titans | 1 | 6 | 0 | 108 | 156 | .143 |
American Football Conference · AFC West
| POS | Team | W | L | T | PF | PA | PCT |
|---|---|---|---|---|---|---|---|
| 1 |  Kansas City Chiefs | 5 | 1 | 0 | 143 | 103 | .833 |
| 2 |  Denver Broncos | 5 | 2 | 0 | 144 | 141 | .714 |
| 3 |  Las Vegas Raiders | 3 | 4 | 0 | 183 | 197 | .429 |
| 4 |  Los Angeles Chargers | 0 | 6 | 0 | 90 | 151 | .000 |
National Football Conference · NFC East
| POS | Team | W | L | T | PF | PA | PCT |
|---|---|---|---|---|---|---|---|
| 1 |  New York Giants | 4 | 2 | 1 | 163 | 161 | .643 |
| 2 |  Philadelphia Eagles | 2 | 4 | 0 | 106 | 137 | .333 |
| 3 |  Dallas Cowboys | 2 | 4 | 0 | 151 | 159 | .333 |
| 4 |  Washington Commanders | 1 | 4 | 1 | 132 | 172 | .250 |
National Football Conference · NFC South
| POS | Team | W | L | T | PF | PA | PCT |
|---|---|---|---|---|---|---|---|
| 1 |  Carolina Panthers | 3 | 3 | 0 | 159 | 166 | .500 |
| 2 |  Atlanta Falcons | 3 | 4 | 0 | 171 | 173 | .429 |
| 3 |  Tampa Bay Buccaneers | 2 | 5 | 0 | 162 | 151 | .286 |
| 4 |  New Orleans Saints | 2 | 5 | 0 | 162 | 194 | .286 |
National Football Conference · NFC West
| POS | Team | W | L | T | PF | PA | PCT |
|---|---|---|---|---|---|---|---|
| 1 |  San Francisco 49ers | 6 | 1 | 0 | 197 | 139 | .857 |
| 2 |  Seattle Seahawks | 4 | 3 | 0 | 168 | 125 | .571 |
| 3 |  Los Angeles Rams | 3 | 4 | 0 | 170 | 159 | .429 |
| 4 |  Arizona Cardinals | 2 | 5 | 0 | 142 | 208 | .286 |