New York Jets 16–24 Tampa Bay Buccaneers

- Season
- NFL
- 2026 · Pre Season · Week 1
NFL: Tampa Bay Buccaneers beat New York Jets 24–16.
Game leaders
 108Brady CookPassing yards
 111Jalon Daniels
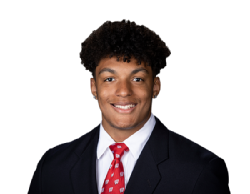 44Braelon AllenRushing yards
 27Josh Williams
 37Cam CamperReceiving yards
 54Garrett Greene
How the score moved
The running score, step by step, with every score marked.
- New York Jets
- Tampa Bay Buccaneers
Show as a table
| When | New York Jets | Tampa Bay Buccaneers |
|---|---|---|
| Q1 7:08 · Cade York | 3 | 0 |
| Q1 2:07 · Braelon Allen | 10 | 0 |
| Q2 9:55 · Chase McLaughlin | 10 | 3 |
| Q2 8:31 · Ayden Garnes | 10 | 10 |
| Q2 0:00 · Cade York | 13 | 10 |
| Q3 5:24 · Josh Williams | 13 | 17 |
| Q4 9:48 · Jason Sanders | 16 | 17 |
| Q4 3:24 · Jalon Daniels | 16 | 24 |
| 60′ | 16 | 24 |
Scoring plays
Q1
- Cade York(Field goal)Q1 7:083–0
- Braelon Allen(Touchdown)Q1 2:0710–0
Q2
- Q2 9:5510–3Chase McLaughlin(Field goal)
- Q2 8:3110–10Ayden Garnes(Touchdown)
- Cade York(Field goal)Q2 0:0013–10
- Q2 9:5510–3
Q3
- Q3 5:2413–17Josh Williams(Touchdown)
- Q3 5:2413–17
Q4
- Jason Sanders(Field goal)Q4 9:4816–17
- Q4 3:2416–24Jalon Daniels(Touchdown)
Quarter by quarter
New York Jets led after 2 of 4 quarters, Tampa Bay Buccaneers after 2. Largest lead at a break: 10 points, New York Jets after Q1. Counted at the end of each period, not throughout.
- New York Jets
- Tampa Bay Buccaneers
| Team | Q1 | Q2 | Q3 | Q4 | T |
|---|---|---|---|---|---|
| New York Jets | 10 | 3 | 0 | 3 | 16 |
| Tampa Bay Buccaneers | 0 | 10 | 7 | 7 | 24 |
Standings
American Football Conference · AFC East
| POS | Team | W | L | T | PF | PA | PCT |
|---|---|---|---|---|---|---|---|
| 1 |  Buffalo Bills | 5 | 1 | 0 | 197 | 171 | .833 |
| 2 |  New England Patriots | 4 | 3 | 0 | 160 | 143 | .571 |
| 3 |  New York Jets | 2 | 5 | 0 | 137 | 150 | .286 |
| 4 |  Miami Dolphins | 1 | 5 | 0 | 98 | 157 | .167 |
National Football Conference · NFC South
| POS | Team | W | L | T | PF | PA | PCT |
|---|---|---|---|---|---|---|---|
| 1 |  Carolina Panthers | 3 | 3 | 0 | 159 | 166 | .500 |
| 2 |  Atlanta Falcons | 3 | 4 | 0 | 171 | 173 | .429 |
| 3 |  Tampa Bay Buccaneers | 2 | 5 | 0 | 162 | 151 | .286 |
| 4 |  New Orleans Saints | 2 | 5 | 0 | 162 | 194 | .286 |
Timeline
Q1
- Cade York(Field goal)Q1 7:083–0
- Braelon Allen(Touchdown)Q1 2:0710–0
Q2
- Q2 9:5510–3Chase McLaughlin(Field goal)
- Q2 8:3110–10Ayden Garnes(Touchdown)
- Cade York(Field goal)Q2 0:0013–10
- Q2 9:5510–3
Q3
- Q3 5:2413–17Josh Williams(Touchdown)
- Q3 5:2413–17
Q4
- Jason Sanders(Field goal)Q4 9:4816–17
- Q4 3:2416–24Jalon Daniels(Touchdown)
Passing
| Brady Cook | 9/15 | 108 | 7.2 | 0 | 1-8 | 82.1 |
| Cade Klubnik | 5/7 | 56 | 8.0 | 0 | 1-2 | 94.9 |
| Bailey Zappe | 6/10 | 55 | 5.5 | 2 | 2-16 | 35.4 |
Rushing
| Braelon Allen | 4 | 44 | 11.0 | 1 | 31 |
| Breece Hall | 4 | 16 | 4.0 | 0 | 14 |
| Sam Scott | 3 | 13 | 4.3 | 0 | 5 |
| Brady Cook | 1 | 8 | 8.0 | 0 | 8 |
| Kene Nwangwu | 6 | 6 | 1.0 | 0 | 5 |
| Chip Trayanum | 3 | 4 | 1.3 | 0 | 3 |
Receiving
| Cam Camper | 4 | 2 | 37 | 18.5 | 24 |
| Garrett Wilson | 3 | 2 | 32 | 16.0 | 21 |
| Quincy Skinner Jr. | 2 | 2 | 31 | 15.5 | 20 |
| Omar Cooper Jr. | 3 | 2 | 31 | 15.5 | 26 |
| Jamaal Pritchett | 4 | 3 | 24 | 8.0 | 11 |
| Mason Taylor | 2 | 2 | 19 | 9.5 | 12 |
| Chip Trayanum | 2 | 2 | 12 | 6.0 | 8 |
| Chase Curtis | 3 | 1 | 10 | 10.0 | 10 |
| Sam Scott | 1 | 1 | 9 | 9.0 | 9 |
| Malik McClain | 2 | 1 | 8 | 8.0 | 8 |
| Kene Nwangwu | 1 | 1 | 4 | 4.0 | 4 |
| Jelani Woods | 2 | 1 | 2 | 2.0 | 2 |
| Arian Smith | 1 | 0 | 0 | 0.0 | 0 |
Fumbles
Defensive
| Mykal Walker | 7 | 4 | 0 | 0 | 0 | 0 | 1 |
| Jarius Monroe | 7 | 4 | 0 | 1 | 0 | 0 | 0 |
| Jordan Clark | 6 | 3 | 0 | 0 | 0 | 0 | 0 |
| Francisco Mauigoa | 5 | 3 | 0 | 0 | 0 | 0 | 0 |
| Mory Bamba | 5 | 3 | 0 | 0 | 4 | 0 | 0 |
| Marcelino McCrary-Ball | 4 | 4 | 0 | 1 | 0 | 0 | 1 |
| Jack Heflin | 3 | 3 | 0 | 1 | 0 | 0 | 0 |
| Dane Belton | 3 | 1 | 0 | 0 | 0 | 0 | 0 |
| Tre Brown | 2 | 2 | 0 | 0 | 0 | 0 | 0 |
| Nathan Voorhis | 2 | 2 | 0 | 0 | 0 | 0 | 0 |
| Harrison Phillips | 2 | 1 | 0 | 0 | 0 | 0 | 0 |
| Jaden Keller | 2 | 1 | 0 | 0 | 0 | 0 | 0 |
| Dean Clark | 2 | 0 | 0 | 0 | 0 | 0 | 0 |
| Braiden McGregor | 2 | 0 | 0 | 0 | 0 | 0 | 0 |
| Will McDonald IV | 1 | 1 | 1 | 1 | 0 | 1 | 0 |
| Andrew Beck | 1 | 1 | 0 | 0 | 0 | 0 | 0 |
| Minkah Fitzpatrick | 1 | 1 | 0 | 0 | 0 | 0 | 0 |
| Kene Nwangwu | 1 | 1 | 0 | 0 | 0 | 0 | 0 |
| Andre Cisco | 1 | 1 | 0 | 0 | 0 | 0 | 0 |
| Ben Barten | 1 | 1 | 0 | 0 | 0 | 0 | 0 |
| Jowon Briggs | 1 | 0 | 0 | 0 | 0 | 0 | 0 |
| Jarvis Brownlee | 1 | 0 | 0 | 0 | 0 | 0 | 0 |
| Payton Page | 1 | 0 | 0 | 0 | 0 | 0 | 0 |
| Chase Wilson | 1 | 0 | 0 | 0 | 0 | 0 | 0 |
| David Bailey | 1 | 0 | 0 | 0 | 0 | 0 | 0 |
| Azareye'h Thomas | 1 | 0 | 0 | 0 | 1 | 0 | 0 |
| Paschal Ekeji Jr. | 1 | 0 | 0 | 0 | 0 | 0 | 0 |
Kick returns
| DT Sheffield | 2 | 54 | 27.0 | 27 |
| Jamaal Pritchett | 1 | 32 | 32.0 | 32 |
Punt returns
| Jamaal Pritchett | 3 | 46 | 15.3 | 19 |
| DT Sheffield | 1 | 3 | 3.0 | 3 |
Kicking
| Cade York | 2/2 | 100.0 | 38 | 0/0 | 6 |
| Jason Sanders | 1/1 | 100.0 | 47 | 1/1 | 4 |
Punting
| Austin McNamara | 3 | 145 | 48.3 | 1 | 49 |
American Football Conference · AFC East
| POS | Team | W | L | T | PF | PA | PCT |
|---|---|---|---|---|---|---|---|
| 1 | Buffalo Bills | 5 | 1 | 0 | 197 | 171 | .833 |
| 2 | New England Patriots | 4 | 3 | 0 | 160 | 143 | .571 |
| 3 | New York Jets | 2 | 5 | 0 | 137 | 150 | .286 |
| 4 | Miami Dolphins | 1 | 5 | 0 | 98 | 157 | .167 |
National Football Conference · NFC South
| POS | Team | W | L | T | PF | PA | PCT |
|---|---|---|---|---|---|---|---|
| 1 | Carolina Panthers | 3 | 3 | 0 | 159 | 166 | .500 |
| 2 | Atlanta Falcons | 3 | 4 | 0 | 171 | 173 | .429 |
| 3 | Tampa Bay Buccaneers | 2 | 5 | 0 | 162 | 151 | .286 |
| 4 | New Orleans Saints | 2 | 5 | 0 | 162 | 194 | .286 |
American Football Conference · AFC North
| POS | Team | W | L | T | PF | PA | PCT |
|---|---|---|---|---|---|---|---|
| 1 |  Cleveland Browns | 5 | 2 | 0 | 133 | 146 | .714 |
| 2 |  Pittsburgh Steelers | 5 | 2 | 0 | 153 | 138 | .714 |
| 3 |  Cincinnati Bengals | 4 | 2 | 0 | 163 | 122 | .667 |
| 4 |  Baltimore Ravens | 4 | 3 | 0 | 169 | 167 | .571 |
American Football Conference · AFC South
| POS | Team | W | L | T | PF | PA | PCT |
|---|---|---|---|---|---|---|---|
| 1 |  Jacksonville Jaguars | 4 | 2 | 0 | 154 | 104 | .667 |
| 2 |  Indianapolis Colts | 2 | 5 | 0 | 154 | 180 | .286 |
| 3 |  Houston Texans | 2 | 5 | 0 | 165 | 170 | .286 |
| 4 |  Tennessee Titans | 1 | 6 | 0 | 108 | 156 | .143 |
American Football Conference · AFC West
| POS | Team | W | L | T | PF | PA | PCT |
|---|---|---|---|---|---|---|---|
| 1 |  Kansas City Chiefs | 5 | 1 | 0 | 143 | 103 | .833 |
| 2 |  Denver Broncos | 5 | 2 | 0 | 144 | 141 | .714 |
| 3 |  Las Vegas Raiders | 3 | 4 | 0 | 183 | 197 | .429 |
| 4 |  Los Angeles Chargers | 0 | 6 | 0 | 90 | 151 | .000 |
National Football Conference · NFC East
| POS | Team | W | L | T | PF | PA | PCT |
|---|---|---|---|---|---|---|---|
| 1 |  New York Giants | 4 | 2 | 1 | 163 | 161 | .643 |
| 2 |  Philadelphia Eagles | 2 | 4 | 0 | 106 | 137 | .333 |
| 3 |  Dallas Cowboys | 2 | 4 | 0 | 151 | 159 | .333 |
| 4 |  Washington Commanders | 1 | 4 | 1 | 132 | 172 | .250 |
National Football Conference · NFC North
| POS | Team | W | L | T | PF | PA | PCT |
|---|---|---|---|---|---|---|---|
| 1 |  Minnesota Vikings | 6 | 0 | 0 | 125 | 74 | 1.000 |
| 2 |  Chicago Bears | 5 | 2 | 0 | 180 | 143 | .714 |
| 3 |  Detroit Lions | 4 | 2 | 0 | 184 | 165 | .667 |
| 4 |  Green Bay Packers | 4 | 3 | 0 | 144 | 145 | .571 |
National Football Conference · NFC West
| POS | Team | W | L | T | PF | PA | PCT |
|---|---|---|---|---|---|---|---|
| 1 |  San Francisco 49ers | 6 | 1 | 0 | 197 | 139 | .857 |
| 2 |  Seattle Seahawks | 4 | 3 | 0 | 168 | 125 | .571 |
| 3 |  Los Angeles Rams | 3 | 4 | 0 | 170 | 159 | .429 |
| 4 |  Arizona Cardinals | 2 | 5 | 0 | 142 | 208 | .286 |