Las Vegas Raiders 30–33 Buffalo Bills
- Season
- NFL
- 2026 · Regular Season · Week 6
NFL: Buffalo Bills beat Las Vegas Raiders 33–30.
Game leaders
 313Kirk CousinsPassing yards
 255Josh Allen
 43Mike WashingtonRushing yards
 95James Cook
 97Tre TuckerReceiving yards
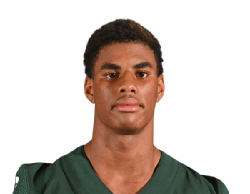 59Keon Coleman
How the score moved
The running score, step by step, with every score marked.
- Las Vegas Raiders
- Buffalo Bills
Show as a table
| When | Las Vegas Raiders | Buffalo Bills |
|---|---|---|
| Q1 10:12 · Tyler Bass | 0 | 3 |
| Q1 4:27 · Ashton Jeanty | 7 | 3 |
| Q2 14:45 · Tyler Bass | 7 | 6 |
| Q2 7:13 · Khalil Shakir | 7 | 13 |
| Q2 2:14 · Matt Gay | 10 | 13 |
| Q2 0:00 · Matt Gay | 13 | 13 |
| Q3 9:45 · Tyler Bass | 13 | 16 |
| Q3 6:22 · Keon Coleman | 13 | 23 |
| Q4 13:32 · Matt Gay | 16 | 23 |
| Q4 8:07 · Tre Tucker | 23 | 23 |
| Q4 4:43 · James Cook | 23 | 30 |
| Q4 1:56 · Tyler Bass | 23 | 33 |
| Q4 1:32 · Tre Tucker | 30 | 33 |
| 60′ | 30 | 33 |
How efficient each offense was
Conversions on the downs that keep drives alive, yards gained per snap and per drive, how each side moved the ball, and who held it.
- Las Vegas Raiders
- Buffalo Bills
Third-down conversions
58%7/1236%4/11
Red-zone touchdowns
40%2/560%3/5
- 6.25.4Yards per play
- 3.003.30Points per drive
- 37.834.5Yards per drive
- 6164Plays
How the yards came
Las Vegas Raiders
Pass 313Rush 65
Buffalo Bills
Pass 242Rush 103
- Time of possession
- 28:1231:48
- Turnover margin
- -1+1
- Sacks made
- 20
- Penalties (yards)
- 7 (62)8 (77)
Show as a table
| Las Vegas Raiders | Buffalo Bills | |
|---|---|---|
| Third-down conversions | 7/12 | 4/11 |
| Red-zone touchdowns | 2/5 | 3/5 |
| Yards per play | 6.2 | 5.4 |
| Points per drive | 3.00 | 3.30 |
| Yards per drive | 37.8 | 34.5 |
| Plays | 61 | 64 |
| Passing yards | 313 | 242 |
| Rushing yards | 65 | 103 |
| Time of possession | 28:12 | 31:48 |
| Turnovers | 1 | 0 |
| Penalties (yards) | 7 (62) | 8 (77) |
Scoring plays
Q1
- Q1 10:120–3Tyler Bass(Field goal)
- Ashton Jeanty(Touchdown)Q1 4:277–3
- Q1 10:120–3
Q2
- Q2 14:457–6Tyler Bass(Field goal)
- Q2 7:137–13Khalil Shakir(Touchdown)
- Matt Gay(Field goal)Q2 2:1410–13
- Matt Gay(Field goal)Q2 0:0013–13
- Q2 14:457–6
Q3
- Q3 9:4513–16Tyler Bass(Field goal)
- Q3 6:2213–23Keon Coleman(Touchdown)
- Q3 9:4513–16
Q4
- Matt Gay(Field goal)Q4 13:3216–23
- Tre Tucker(Touchdown)Q4 8:0723–23
- Q4 4:4323–30James Cook(Touchdown)
- Q4 1:5623–33Tyler Bass(Field goal)
- Tre Tucker(Touchdown)Q4 1:3230–33
Key stats
- 378Total yards345
- 313Passing yards242
- 65Rushing yards103
- 25First downs23
- 61Total plays64
- 6.2Yards per play5.4
- 7.6Yards per pass6.9
- 3.3Yards per rush3.6
- 23/41Comp / Att23/33
- 20Rushing attempts29
Quarter by quarter
Las Vegas Raiders led after 1 of 4 quarters, Buffalo Bills after 2. Largest lead at a break: 10 points, Buffalo Bills after Q3. Counted at the end of each period, not throughout.
- Las Vegas Raiders
- Buffalo Bills
| Team | Q1 | Q2 | Q3 | Q4 | T |
|---|---|---|---|---|---|
| Las Vegas Raiders | 7 | 6 | 0 | 17 | 30 |
| Buffalo Bills | 3 | 10 | 10 | 10 | 33 |
Facts
From each side's recent results and their meetings, before this game.
 Las Vegas Raiders: 3 won, 2 lost in their last 5 games.
- Las Vegas Raiders scored 132 points and allowed 129 in their last 5 games.
 Buffalo Bills: 4 won, 1 lost in their last 5 games.
- Buffalo Bills scored 164 points and allowed 141 in their last 5 games.
Recent form
Standings
American Football Conference · AFC East
| POS | Team | W | L | T | PF | PA | PCT |
|---|---|---|---|---|---|---|---|
| 1 | Buffalo Bills | 5 | 1 | 0 | 197 | 171 | .833 |
| 2 |  New England Patriots | 4 | 3 | 0 | 160 | 143 | .571 |
| 3 |  New York Jets | 2 | 5 | 0 | 137 | 150 | .286 |
| 4 |  Miami Dolphins | 1 | 5 | 0 | 98 | 157 | .167 |
American Football Conference · AFC West
| POS | Team | W | L | T | PF | PA | PCT |
|---|---|---|---|---|---|---|---|
| 1 |  Kansas City Chiefs | 5 | 1 | 0 | 143 | 103 | .833 |
| 2 |  Denver Broncos | 5 | 2 | 0 | 144 | 141 | .714 |
| 3 | Las Vegas Raiders | 3 | 4 | 0 | 183 | 197 | .429 |
| 4 |  Los Angeles Chargers | 0 | 6 | 0 | 90 | 151 | .000 |
Timeline
Q1
- Q1 10:120–3Tyler Bass(Field goal)
- Ashton Jeanty(Touchdown)Q1 4:277–3
- Q1 10:120–3
Q2
- Q2 14:457–6Tyler Bass(Field goal)
- Q2 7:137–13Khalil Shakir(Touchdown)
- Matt Gay(Field goal)Q2 2:1410–13
- Matt Gay(Field goal)Q2 0:0013–13
- Q2 14:457–6
Q3
- Q3 9:4513–16Tyler Bass(Field goal)
- Q3 6:2213–23Keon Coleman(Touchdown)
- Q3 9:4513–16
Q4
- Matt Gay(Field goal)Q4 13:3216–23
- Tre Tucker(Touchdown)Q4 8:0723–23
- Q4 4:4323–30James Cook(Touchdown)
- Q4 1:5623–33Tyler Bass(Field goal)
- Tre Tucker(Touchdown)Q4 1:3230–33
How efficient each offense was
Conversions on the downs that keep drives alive, yards gained per snap and per drive, how each side moved the ball, and who held it.
- Las Vegas Raiders
- Buffalo Bills
Third-down conversions
58%7/1236%4/11
Red-zone touchdowns
40%2/560%3/5
- 6.25.4Yards per play
- 3.003.30Points per drive
- 37.834.5Yards per drive
- 6164Plays
How the yards came
Las Vegas Raiders
Pass 313Rush 65
Buffalo Bills
Pass 242Rush 103
- Time of possession
- 28:1231:48
- Turnover margin
- -1+1
- Sacks made
- 20
- Penalties (yards)
- 7 (62)8 (77)
Show as a table
| Las Vegas Raiders | Buffalo Bills | |
|---|---|---|
| Third-down conversions | 7/12 | 4/11 |
| Red-zone touchdowns | 2/5 | 3/5 |
| Yards per play | 6.2 | 5.4 |
| Points per drive | 3.00 | 3.30 |
| Yards per drive | 37.8 | 34.5 |
| Plays | 61 | 64 |
| Passing yards | 313 | 242 |
| Rushing yards | 65 | 103 |
| Time of possession | 28:12 | 31:48 |
| Turnovers | 1 | 0 |
| Penalties (yards) | 7 (62) | 8 (77) |
Where the points came from, quarter by quarter
Each side's points in each quarter, split by how they were scored.
- Las Vegas Raiders
- Buffalo Bills
- Touchdowns
- Field goals
- Extra points and conversions
7
3
6
10
10
17
10
Show as a table
| Quarter | Las Vegas Raiders · Touchdowns | Buffalo Bills · Touchdowns | Las Vegas Raiders · Field goals | Buffalo Bills · Field goals | Las Vegas Raiders · Extra points and conversions | Buffalo Bills · Extra points and conversions |
|---|---|---|---|---|---|---|
| Q1 | 6 | 0 | 0 | 3 | 1 | 0 |
| Q2 | 0 | 6 | 6 | 3 | 0 | 1 |
| Q3 | 0 | 6 | 0 | 3 | 0 | 1 |
| Q4 | 12 | 6 | 3 | 3 | 2 | 1 |
The yards, and how efficiently they came
Each side's leading passer, rusher and receiver, with the rate behind the total.
Passing
Kirk Cousins
23/41 completions
313yards2 TD
Josh Allen
23/33 completions
255yards2 TD
Rushing
Mike Washington
9 carries
43yards
James Cook
22 carries
95yards1 TD
Receiving
Tre Tucker
5/7 caught/targeted
97yards2 TD
Keon Coleman
4/6 caught/targeted
59yards1 TD
- Las Vegas Raiders
- Buffalo Bills
Offence
- 378Total yards345
- 313Passing yards242
- 65Rushing yards103
- 25First downs23
- 61Total plays64
- 6.2Yards per play5.4
- 7.6Yards per pass6.9
- 3.3Yards per rush3.6
- 23/41Comp / Att23/33
- 20Rushing attempts29
Efficiency
- 7-123rd down efficiency4-11
- 0-04th down efficiency0-0
- 2-5Red zone (made / att)3-5
- 10Drives10
- 28:12Possession31:48
Turnovers & penalties
- 1Turnovers0
- 1Interceptions thrown0
- 0Fumbles lost0
- 7-62Penalties8-77
- 2Sacks0
- 0-0Sacks – yards lost2-13
Defence
- 0Interceptions1
- 0Interception touchdowns0
- 0Safeties0
Quarter by quarter
Las Vegas Raiders led after 1 of 4 quarters, Buffalo Bills after 2. Largest lead at a break: 10 points, Buffalo Bills after Q3. Counted at the end of each period, not throughout.
- Las Vegas Raiders
- Buffalo Bills
| Team | Q1 | Q2 | Q3 | Q4 | T |
|---|---|---|---|---|---|
| Las Vegas Raiders | 7 | 6 | 0 | 17 | 30 |
| Buffalo Bills | 3 | 10 | 10 | 10 | 33 |
Passing
| Kirk Cousins | 23/41 | 313 | 7.6 | 2 | 1 | 58.5 |
Rushing
| Mike Washington | 9 | 43 | 4.8 | 0 | 18 |
| Ashton Jeanty | 10 | 22 | 2.2 | 1 | 8 |
| Dylan Laube | 1 | 0 | 0.0 | 0 | 0 |
Receiving
| Tre Tucker | 7 | 5 | 97 | 19.4 | 2 | 44 |
| Michael Mayer | 9 | 7 | 95 | 13.6 | 0 | 28 |
| Brock Bowers | 9 | 4 | 70 | 17.5 | 0 | 29 |
| Ashton Jeanty | 6 | 4 | 36 | 9.0 | 0 | 15 |
| Jalen Nailor | 4 | 1 | 9 | 9.0 | 0 | 9 |
| Mike Washington | 1 | 1 | 7 | 7.0 | 0 | 7 |
| Cody White | 2 | 0 | 0 | 0.0 | 0 | 0 |
| Dylan Laube | 1 | 1 | -1 | -1.0 | 0 | -1 |
Defensive
| Nakobe Dean | 12 | 3 | 0 | 1 | 0 | 0 |
| Jeremy Chinn | 10 | 9 | 0 | 0 | 0 | 1 |
| Treydan Stukes | 9 | 5 | 0 | 0 | 1 | 0 |
| Quay Walker | 6 | 3 | 1 | 1 | 0 | 1 |
| Maxx Crosby | 5 | 2 | 0 | 1 | 0 | 2 |
| Taron Johnson | 4 | 2 | 0 | 0 | 0 | 0 |
| Eric Stokes | 3 | 2 | 0 | 0 | 0 | 0 |
| Isaiah Pola-Mao | 3 | 2 | 0 | 0 | 0 | 0 |
| Kwity Paye | 3 | 1 | 1 | 1 | 0 | 1 |
| Thomas Booker IV | 2 | 2 | 0 | 0 | 0 | 0 |
| Darien Porter | 2 | 2 | 0 | 0 | 1 | 0 |
| Cody Lindenberg | 2 | 1 | 0 | 0 | 0 | 0 |
| Jonah Laulu | 2 | 0 | 0 | 0 | 0 | 0 |
| Tommy Eichenberg | 2 | 0 | 0 | 0 | 0 | 0 |
| Darrell Luter Jr. | 2 | 0 | 0 | 0 | 0 | 0 |
| Malcolm Koonce | 1 | 1 | 0 | 0 | 0 | 0 |
| Matt Gay | 1 | 1 | 0 | 0 | 0 | 0 |
| Dareke Young | 1 | 1 | 0 | 0 | 0 | 0 |
| Michael Mayer | 1 | 1 | 0 | 0 | 0 | 0 |
| JJ Pegues | 1 | 1 | 0 | 0 | 0 | 0 |
| Adam Butler | 1 | 0 | 0 | 0 | 0 | 0 |
| Folorunso Fatukasi | 1 | 0 | 0 | 0 | 0 | 0 |
| Hezekiah Masses | 1 | 0 | 0 | 0 | 0 | 1 |
Kick returns
| Dareke Young | 6 | 150 | 25.0 | 27 |
| Dylan Laube | 2 | 54 | 27.0 | 29 |
Kicking
| Matt Gay | 3/3 | 100.0 | 35 | 3/3 | 12 |
Punting
| AJ Cole | 3 | 166 | 55.3 | 1 | 57 |
American Football Conference · AFC East
| POS | Team | W | L | T | PF | PA | PCT |
|---|---|---|---|---|---|---|---|
| 1 | Buffalo Bills | 5 | 1 | 0 | 197 | 171 | .833 |
| 2 | New England Patriots | 4 | 3 | 0 | 160 | 143 | .571 |
| 3 | New York Jets | 2 | 5 | 0 | 137 | 150 | .286 |
| 4 | Miami Dolphins | 1 | 5 | 0 | 98 | 157 | .167 |
American Football Conference · AFC West
| POS | Team | W | L | T | PF | PA | PCT |
|---|---|---|---|---|---|---|---|
| 1 | Kansas City Chiefs | 5 | 1 | 0 | 143 | 103 | .833 |
| 2 | Denver Broncos | 5 | 2 | 0 | 144 | 141 | .714 |
| 3 | Las Vegas Raiders | 3 | 4 | 0 | 183 | 197 | .429 |
| 4 | Los Angeles Chargers | 0 | 6 | 0 | 90 | 151 | .000 |
American Football Conference · AFC North
| POS | Team | W | L | T | PF | PA | PCT |
|---|---|---|---|---|---|---|---|
| 1 |  Cleveland Browns | 5 | 2 | 0 | 133 | 146 | .714 |
| 2 |  Pittsburgh Steelers | 5 | 2 | 0 | 153 | 138 | .714 |
| 3 |  Cincinnati Bengals | 4 | 2 | 0 | 163 | 122 | .667 |
| 4 |  Baltimore Ravens | 4 | 3 | 0 | 169 | 167 | .571 |
American Football Conference · AFC South
| POS | Team | W | L | T | PF | PA | PCT |
|---|---|---|---|---|---|---|---|
| 1 |  Jacksonville Jaguars | 4 | 2 | 0 | 154 | 104 | .667 |
| 2 |  Indianapolis Colts | 2 | 5 | 0 | 154 | 180 | .286 |
| 3 |  Houston Texans | 2 | 5 | 0 | 165 | 170 | .286 |
| 4 |  Tennessee Titans | 1 | 6 | 0 | 108 | 156 | .143 |
National Football Conference · NFC East
| POS | Team | W | L | T | PF | PA | PCT |
|---|---|---|---|---|---|---|---|
| 1 |  New York Giants | 4 | 2 | 1 | 163 | 161 | .643 |
| 2 |  Philadelphia Eagles | 2 | 4 | 0 | 106 | 137 | .333 |
| 3 |  Dallas Cowboys | 2 | 4 | 0 | 151 | 159 | .333 |
| 4 |  Washington Commanders | 1 | 4 | 1 | 132 | 172 | .250 |
National Football Conference · NFC North
| POS | Team | W | L | T | PF | PA | PCT |
|---|---|---|---|---|---|---|---|
| 1 |  Minnesota Vikings | 6 | 0 | 0 | 125 | 74 | 1.000 |
| 2 |  Chicago Bears | 5 | 2 | 0 | 180 | 143 | .714 |
| 3 |  Detroit Lions | 4 | 2 | 0 | 184 | 165 | .667 |
| 4 |  Green Bay Packers | 4 | 3 | 0 | 144 | 145 | .571 |
National Football Conference · NFC South
| POS | Team | W | L | T | PF | PA | PCT |
|---|---|---|---|---|---|---|---|
| 1 |  Carolina Panthers | 3 | 3 | 0 | 159 | 166 | .500 |
| 2 |  Atlanta Falcons | 3 | 4 | 0 | 171 | 173 | .429 |
| 3 |  Tampa Bay Buccaneers | 2 | 5 | 0 | 162 | 151 | .286 |
| 4 |  New Orleans Saints | 2 | 5 | 0 | 162 | 194 | .286 |
National Football Conference · NFC West
| POS | Team | W | L | T | PF | PA | PCT |
|---|---|---|---|---|---|---|---|
| 1 |  San Francisco 49ers | 6 | 1 | 0 | 197 | 139 | .857 |
| 2 |  Seattle Seahawks | 4 | 3 | 0 | 168 | 125 | .571 |
| 3 |  Los Angeles Rams | 3 | 4 | 0 | 170 | 159 | .429 |
| 4 |  Arizona Cardinals | 2 | 5 | 0 | 142 | 208 | .286 |