Dallas Cowboys 24–27 New Orleans Saints
- Season
- NFL
- 2026 · Pre Season · Week 3
NFL: New Orleans Saints beat Dallas Cowboys 27–24.
Game leaders
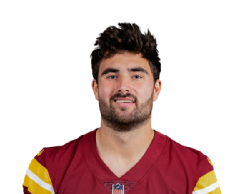 155Sam HowellPassing yards
 93Zach Wilson
 46Phil MafahRushing yards
 46Audric Estime
 97Jordan HudsonReceiving yards
 65Ronnie Bell
How the score moved
The running score, step by step, with every score marked.
- Dallas Cowboys
- New Orleans Saints
Show as a table
| When | Dallas Cowboys | New Orleans Saints |
|---|---|---|
| Q1 11:47 · Daniel Carlson | 0 | 3 |
| Q1 7:53 · Brandon Aubrey | 3 | 3 |
| Q1 3:06 · Barion Brown | 3 | 10 |
| Q2 14:00 · Brandon Aubrey | 6 | 10 |
| Q2 2:01 · Spencer Rattler | 6 | 17 |
| Q2 0:23 · Brandon Aubrey | 9 | 17 |
| Q3 9:41 · Zamir White | 9 | 24 |
| Q4 14:53 · Jordan Hudson | 16 | 24 |
| Q4 6:11 · Mitch Van Vooren | 24 | 24 |
| Q4 1:55 · Daniel Carlson | 24 | 27 |
| 60′ | 24 | 27 |
How efficient each offense was
Conversions on the downs that keep drives alive, yards gained per snap and per drive, how each side moved the ball, and who held it.
- Dallas Cowboys
- New Orleans Saints
Third-down conversions
43%6/1433%3/9
Fourth-down conversions
50%1/2100%1/1
Red-zone touchdowns
–0/075%3/4
- 5.45.8Yards per play
- 2.672.70Points per drive
- 36.432.6Yards per drive
- 6156Plays
How the yards came
Dallas Cowboys
Pass 237Rush 91
New Orleans Saints
Pass 157Rush 169
- Time of possession
- 29:4330:17
- Turnover margin
- 00
- Sacks made
- 22
- Penalties (yards)
- 6 (45)4 (39)
Show as a table
| Dallas Cowboys | New Orleans Saints | |
|---|---|---|
| Third-down conversions | 6/14 | 3/9 |
| Fourth-down conversions | 1/2 | 1/1 |
| Red-zone touchdowns | 0/0 | 3/4 |
| Yards per play | 5.4 | 5.8 |
| Points per drive | 2.67 | 2.70 |
| Yards per drive | 36.4 | 32.6 |
| Plays | 61 | 56 |
| Passing yards | 237 | 157 |
| Rushing yards | 91 | 169 |
| Time of possession | 29:43 | 30:17 |
| Turnovers | 0 | 0 |
| Penalties (yards) | 6 (45) | 4 (39) |
Scoring plays
Q1
- Q1 11:470–3Daniel Carlson(Field goal)
- Brandon Aubrey(Field goal)Q1 7:533–3
- Q1 3:063–10Barion Brown(Touchdown)
- Q1 11:470–3
Q2
- Brandon Aubrey(Field goal)Q2 14:006–10
- Q2 2:016–17Spencer Rattler(Touchdown)
- Brandon Aubrey(Field goal)Q2 0:239–17
Q3
- Q3 9:419–24Zamir White(Touchdown)
- Q3 9:419–24
Q4
- Jordan Hudson(Touchdown)Q4 14:5316–24
- Mitch Van Vooren(Touchdown)Q4 6:1124–24
- Q4 1:5524–27Daniel Carlson(Field goal)
Key stats
- 328Total yards326
- 237Passing yards157
- 91Rushing yards169
- 18First downs23
- 61Total plays56
- 5.4Yards per play5.8
- 6.8Yards per pass6.5
- 3.5Yards per rush5.3
- 20/33Comp / Att17/22
- 26Rushing attempts32
Quarter by quarter
Dallas Cowboys led after 0 of 4 quarters, New Orleans Saints after 4. Largest lead at a break: 15 points, New Orleans Saints after Q3. Counted at the end of each period, not throughout.
- Dallas Cowboys
- New Orleans Saints
| Team | Q1 | Q2 | Q3 | Q4 | T |
|---|---|---|---|---|---|
| Dallas Cowboys | 3 | 6 | 0 | 15 | 24 |
| New Orleans Saints | 10 | 7 | 7 | 3 | 27 |
Facts
From each side's recent results and their meetings, before this game.
 Dallas Cowboys: 2 won, 0 lost in their last 2 games.
- Dallas Cowboys scored 51 points and allowed 20 in their last 2 games.
 New Orleans Saints: 0 won, 2 lost in their last 2 games.
- New Orleans Saints scored 20 points and allowed 58 in their last 2 games.
Recent form
Standings
National Football Conference · NFC East
| POS | Team | W | L | T | PF | PA | PCT |
|---|---|---|---|---|---|---|---|
| 1 |  New York Giants | 4 | 2 | 1 | 163 | 161 | .643 |
| 2 |  Philadelphia Eagles | 2 | 4 | 0 | 106 | 137 | .333 |
| 3 | Dallas Cowboys | 2 | 4 | 0 | 151 | 159 | .333 |
| 4 |  Washington Commanders | 1 | 4 | 1 | 132 | 172 | .250 |
National Football Conference · NFC South
| POS | Team | W | L | T | PF | PA | PCT |
|---|---|---|---|---|---|---|---|
| 1 |  Carolina Panthers | 3 | 3 | 0 | 159 | 166 | .500 |
| 2 |  Atlanta Falcons | 3 | 4 | 0 | 171 | 173 | .429 |
| 3 |  Tampa Bay Buccaneers | 2 | 5 | 0 | 162 | 151 | .286 |
| 4 | New Orleans Saints | 2 | 5 | 0 | 162 | 194 | .286 |
Timeline
Q1
- Q1 11:470–3Daniel Carlson(Field goal)
- Brandon Aubrey(Field goal)Q1 7:533–3
- Q1 3:063–10Barion Brown(Touchdown)
- Q1 11:470–3
Q2
- Brandon Aubrey(Field goal)Q2 14:006–10
- Q2 2:016–17Spencer Rattler(Touchdown)
- Brandon Aubrey(Field goal)Q2 0:239–17
Q3
- Q3 9:419–24Zamir White(Touchdown)
- Q3 9:419–24
Q4
- Jordan Hudson(Touchdown)Q4 14:5316–24
- Mitch Van Vooren(Touchdown)Q4 6:1124–24
- Q4 1:5524–27Daniel Carlson(Field goal)
How efficient each offense was
Conversions on the downs that keep drives alive, yards gained per snap and per drive, how each side moved the ball, and who held it.
- Dallas Cowboys
- New Orleans Saints
Third-down conversions
43%6/1433%3/9
Fourth-down conversions
50%1/2100%1/1
Red-zone touchdowns
–0/075%3/4
- 5.45.8Yards per play
- 2.672.70Points per drive
- 36.432.6Yards per drive
- 6156Plays
How the yards came
Dallas Cowboys
Pass 237Rush 91
New Orleans Saints
Pass 157Rush 169
- Time of possession
- 29:4330:17
- Turnover margin
- 00
- Sacks made
- 22
- Penalties (yards)
- 6 (45)4 (39)
Show as a table
| Dallas Cowboys | New Orleans Saints | |
|---|---|---|
| Third-down conversions | 6/14 | 3/9 |
| Fourth-down conversions | 1/2 | 1/1 |
| Red-zone touchdowns | 0/0 | 3/4 |
| Yards per play | 5.4 | 5.8 |
| Points per drive | 2.67 | 2.70 |
| Yards per drive | 36.4 | 32.6 |
| Plays | 61 | 56 |
| Passing yards | 237 | 157 |
| Rushing yards | 91 | 169 |
| Time of possession | 29:43 | 30:17 |
| Turnovers | 0 | 0 |
| Penalties (yards) | 6 (45) | 4 (39) |
Where the points came from, quarter by quarter
Each side's points in each quarter, split by how they were scored.
- Dallas Cowboys
- New Orleans Saints
- Touchdowns
- Field goals
- Extra points and conversions
3
10
6
7
7
15
3
Show as a table
| Quarter | Dallas Cowboys · Touchdowns | New Orleans Saints · Touchdowns | Dallas Cowboys · Field goals | New Orleans Saints · Field goals | Dallas Cowboys · Extra points and conversions | New Orleans Saints · Extra points and conversions |
|---|---|---|---|---|---|---|
| Q1 | 0 | 6 | 3 | 3 | 0 | 1 |
| Q2 | 0 | 6 | 6 | 0 | 0 | 1 |
| Q3 | 0 | 6 | 0 | 0 | 0 | 1 |
| Q4 | 12 | 0 | 0 | 3 | 3 | 0 |
The yards, and how efficiently they came
Each side's leading passer, rusher and receiver, with the rate behind the total.
Passing
Sam Howell
12/18 completions
155yards2 TD
Zach Wilson
9/12 completions
93yards
Rushing
Phil Mafah
12 carries
46yards
Audric Estime
4 carries
46yards
Receiving
Jordan Hudson
4/5 caught/targeted
97yards1 TD
Ronnie Bell
6/7 caught/targeted
65yards
- Dallas Cowboys
- New Orleans Saints
Offence
- 328Total yards326
- 237Passing yards157
- 91Rushing yards169
- 18First downs23
- 61Total plays56
- 5.4Yards per play5.8
- 6.8Yards per pass6.5
- 3.5Yards per rush5.3
- 20/33Comp / Att17/22
- 26Rushing attempts32
Efficiency
- 6-143rd down efficiency3-9
- 1-24th down efficiency1-1
- 0-0Red zone (made / att)3-4
- 9Drives10
- 29:43Possession30:17
Turnovers & penalties
- 0Turnovers0
- 0Interceptions thrown0
- 0Fumbles lost0
- 6-45Penalties4-39
- 2Sacks2
- 2-10Sacks – yards lost2-15
Defence
- 0Interceptions0
- 0Interception touchdowns0
- 0Safeties0
Quarter by quarter
Dallas Cowboys led after 0 of 4 quarters, New Orleans Saints after 4. Largest lead at a break: 15 points, New Orleans Saints after Q3. Counted at the end of each period, not throughout.
- Dallas Cowboys
- New Orleans Saints
| Team | Q1 | Q2 | Q3 | Q4 | T |
|---|---|---|---|---|---|
| Dallas Cowboys | 3 | 6 | 0 | 15 | 24 |
| New Orleans Saints | 10 | 7 | 7 | 3 | 27 |
Passing
| Sam Howell | 12/18 | 155 | 8.6 | 2 | 2-10 | 130.6 |
| Joe Milton III | 8/15 | 92 | 6.1 | 0 | 0-0 | 72.1 |
Rushing
| Phil Mafah | 12 | 46 | 3.8 | 10 | 0 |
| Israel Abanikanda | 7 | 16 | 2.3 | 6 | 0 |
| Jashaun Corbin | 3 | 14 | 4.7 | 7 | 0 |
| Tyler Johnson | 1 | 11 | 11.0 | 11 | 0 |
| Sam Howell | 1 | 2 | 2.0 | 2 | 1 |
| Joe Milton III | 2 | 2 | 1.0 | 2 | 0 |
Receiving
| Jordan Hudson | 5 | 4 | 97 | 24.3 | 1 | 52 |
| Marquez Valdes-Scantling | 3 | 2 | 31 | 15.5 | 0 | 20 |
| Mitch Van Vooren | 3 | 2 | 27 | 13.5 | 1 | 21 |
| Camden Brown | 2 | 1 | 27 | 27.0 | 0 | 27 |
| Anthony Smith | 4 | 3 | 19 | 6.3 | 0 | 10 |
| Tyler Johnson | 3 | 3 | 16 | 5.3 | 0 | 7 |
| Israel Abanikanda | 3 | 3 | 16 | 5.3 | 0 | 9 |
| Zack Kuntz | 2 | 1 | 9 | 9.0 | 0 | 9 |
| Jaden Smith | 4 | 1 | 5 | 5.0 | 0 | 5 |
| Jashaun Corbin | 1 | 0 | 0 | 0.0 | 0 | 0 |
| Michael Trigg | 3 | 0 | 0 | 0.0 | 0 | 0 |
Fumbles
Defensive
| Trikweze Bridges | 7 | 6 | 0 | 0 | 0 |
| Sam Williams | 6 | 3 | 1 | 1 | 2 |
| Julius Wood | 6 | 1 | 0 | 0 | 0 |
| Ameer Speed | 4 | 4 | 0 | 0 | 0 |
| Reddy Steward | 4 | 3 | 0 | 0 | 0 |
| Tyrus Wheat | 4 | 2 | 1 | 1 | 1 |
| Langston Patterson | 4 | 2 | 0 | 0 | 1 |
| Derion Kendrick | 4 | 1 | 0 | 1 | 0 |
| Tommy Dunn Jr. | 4 | 1 | 0 | 1 | 0 |
| Adedayo Odeleye | 2 | 2 | 0 | 0 | 0 |
| Josh Butler | 2 | 1 | 0 | 0 | 0 |
| Caelen Carson | 2 | 1 | 0 | 0 | 0 |
| Jay Toia | 2 | 1 | 0 | 0 | 0 |
| Alijah Clark | 2 | 1 | 0 | 0 | 0 |
| Zion Childress | 2 | 1 | 0 | 0 | 0 |
| Curtis Robinson | 2 | 0 | 0 | 0 | 0 |
| Markquese Bell | 2 | 0 | 0 | 0 | 0 |
| Justin Barron | 2 | 0 | 0 | 0 | 0 |
| Isaiah Land | 2 | 0 | 0 | 0 | 0 |
| Jaishawn Barham | 2 | 0 | 0 | 0 | 0 |
| Shemar James | 1 | 1 | 0 | 0 | 1 |
| Jordan Hudson | 1 | 1 | 0 | 0 | 0 |
| Devin Moore | 1 | 1 | 0 | 0 | 0 |
| James Houston | 1 | 0 | 0 | 0 | 0 |
| Jashaun Corbin | 1 | 0 | 0 | 0 | 0 |
| Marist Liufau | 1 | 0 | 0 | 0 | 0 |
| Israel Abanikanda | 1 | 0 | 0 | 0 | 0 |
| D.J. Withers | 1 | 0 | 0 | 0 | 0 |
Kick returns
| Israel Abanikanda | 2 | 54 | 27.0 | 28 |
| Jashaun Corbin | 2 | 51 | 25.5 | 28 |
Kicking
| Brandon Aubrey | 3/4 | 75.0 | 58 | 1/1 | 10 |
Punting
| Bryan Anger | 2 | 104 | 52.0 | 1 | 59 |
National Football Conference · NFC East
| POS | Team | W | L | T | PF | PA | PCT |
|---|---|---|---|---|---|---|---|
| 1 | New York Giants | 4 | 2 | 1 | 163 | 161 | .643 |
| 2 | Philadelphia Eagles | 2 | 4 | 0 | 106 | 137 | .333 |
| 3 | Dallas Cowboys | 2 | 4 | 0 | 151 | 159 | .333 |
| 4 | Washington Commanders | 1 | 4 | 1 | 132 | 172 | .250 |
National Football Conference · NFC South
| POS | Team | W | L | T | PF | PA | PCT |
|---|---|---|---|---|---|---|---|
| 1 | Carolina Panthers | 3 | 3 | 0 | 159 | 166 | .500 |
| 2 | Atlanta Falcons | 3 | 4 | 0 | 171 | 173 | .429 |
| 3 | Tampa Bay Buccaneers | 2 | 5 | 0 | 162 | 151 | .286 |
| 4 | New Orleans Saints | 2 | 5 | 0 | 162 | 194 | .286 |
American Football Conference · AFC East
| POS | Team | W | L | T | PF | PA | PCT |
|---|---|---|---|---|---|---|---|
| 1 |  Buffalo Bills | 5 | 1 | 0 | 197 | 171 | .833 |
| 2 |  New England Patriots | 4 | 3 | 0 | 160 | 143 | .571 |
| 3 |  New York Jets | 2 | 5 | 0 | 137 | 150 | .286 |
| 4 |  Miami Dolphins | 1 | 5 | 0 | 98 | 157 | .167 |
American Football Conference · AFC North
| POS | Team | W | L | T | PF | PA | PCT |
|---|---|---|---|---|---|---|---|
| 1 |  Cleveland Browns | 5 | 2 | 0 | 133 | 146 | .714 |
| 2 |  Pittsburgh Steelers | 5 | 2 | 0 | 153 | 138 | .714 |
| 3 |  Cincinnati Bengals | 4 | 2 | 0 | 163 | 122 | .667 |
| 4 |  Baltimore Ravens | 4 | 3 | 0 | 169 | 167 | .571 |
American Football Conference · AFC South
| POS | Team | W | L | T | PF | PA | PCT |
|---|---|---|---|---|---|---|---|
| 1 |  Jacksonville Jaguars | 4 | 2 | 0 | 154 | 104 | .667 |
| 2 |  Indianapolis Colts | 2 | 5 | 0 | 154 | 180 | .286 |
| 3 |  Houston Texans | 2 | 5 | 0 | 165 | 170 | .286 |
| 4 |  Tennessee Titans | 1 | 6 | 0 | 108 | 156 | .143 |
American Football Conference · AFC West
| POS | Team | W | L | T | PF | PA | PCT |
|---|---|---|---|---|---|---|---|
| 1 |  Kansas City Chiefs | 5 | 1 | 0 | 143 | 103 | .833 |
| 2 |  Denver Broncos | 5 | 2 | 0 | 144 | 141 | .714 |
| 3 |  Las Vegas Raiders | 3 | 4 | 0 | 183 | 197 | .429 |
| 4 |  Los Angeles Chargers | 0 | 6 | 0 | 90 | 151 | .000 |
National Football Conference · NFC North
| POS | Team | W | L | T | PF | PA | PCT |
|---|---|---|---|---|---|---|---|
| 1 |  Minnesota Vikings | 6 | 0 | 0 | 125 | 74 | 1.000 |
| 2 |  Chicago Bears | 5 | 2 | 0 | 180 | 143 | .714 |
| 3 |  Detroit Lions | 4 | 2 | 0 | 184 | 165 | .667 |
| 4 |  Green Bay Packers | 4 | 3 | 0 | 144 | 145 | .571 |
National Football Conference · NFC West
| POS | Team | W | L | T | PF | PA | PCT |
|---|---|---|---|---|---|---|---|
| 1 |  San Francisco 49ers | 6 | 1 | 0 | 197 | 139 | .857 |
| 2 |  Seattle Seahawks | 4 | 3 | 0 | 168 | 125 | .571 |
| 3 |  Los Angeles Rams | 3 | 4 | 0 | 170 | 159 | .429 |
| 4 |  Arizona Cardinals | 2 | 5 | 0 | 142 | 208 | .286 |